- Why do you think Mr Winiata drew a question mark?:
He put it down as no fruit.
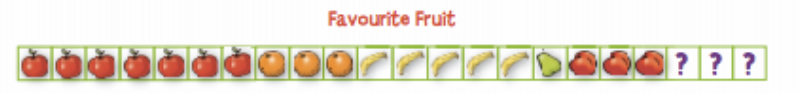
2. Each student chose one of the fruits or the ? and drew it on a blank choice square. Jo collected all these choice squares to display the results.
Jo made a strip graph like this:
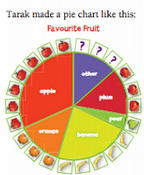
Kim made a bar graph like this: Tarak made a pie chart like this:
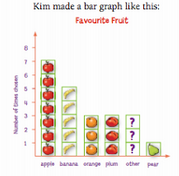
Which graph do you think most clearly shows Room 8’s favourite fruit? Explain why.
The most clearly graph that shows Room 8’s favourite fruit is the bar graph that Kim made. The reason why I think that it is the bar graph because the bar graph has numbers on the side which easily shows what the most common fruit is, it also has the name of the fruits.
------------------------------------------------------------------------------------------------------------
This week we have been learning all about graphs and what we had to do was that we had to answer these questions that our teach has given us and post them on our bog. This is all what we think the best graph is.
Hi kura
ReplyDeleteI like your maths work:)